Why Neural Network
Neural Networks and ReLU
Hello, everyone. I recently gave a talk on neural networks at the NISER Coding Club. The address was intended for a general audience, so I avoided using technical jargon.
In this post, I will convey the same information, but before I begin, I would like to point out that this blog contains some exercises designed for you to absorb the material fully. If you are ready, let’s start.
ReLU
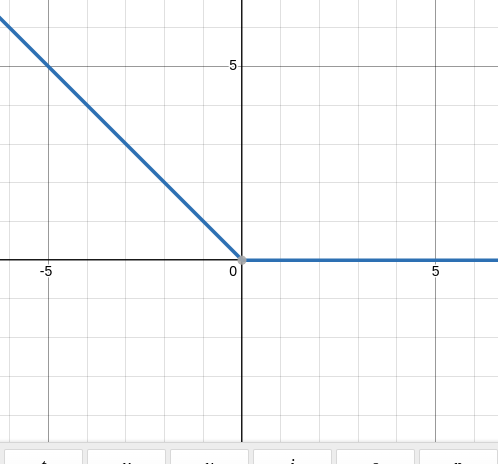
The ReLU function is defined as:
\[\sigma(x) = \max(0,x)\]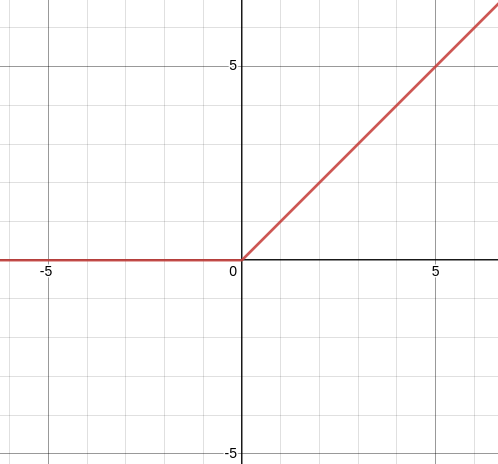
Examples of ReLU
Let’s explore variations of the ReLU function through some examples. I encourage you to practice by drawing the graph on paper before checking against the provided plots.
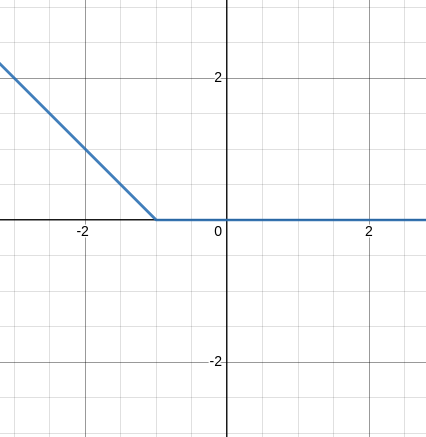
\[\sigma(x+1)\]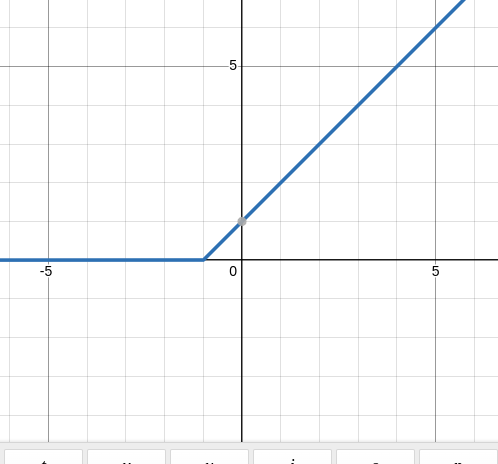
Some More Examples
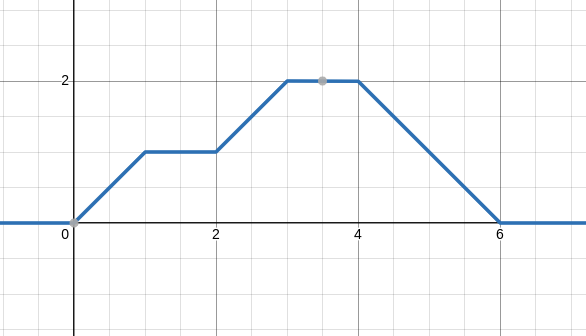
\[\sigma(x)- \sigma(x-1)\]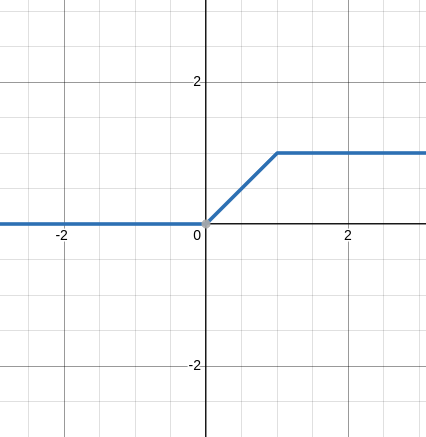
Some Exercise
This Exercise will make the above Idea concrete in your mind, and you will have no problem understanding the next part of the blog.
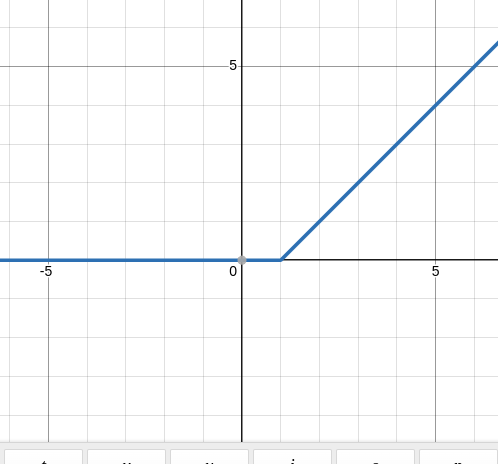
- Plot the graph of the following function \(-\sigma(x-1)\)
- Plot the graph of the following function \(\sigma(x-2)\)
- Plot the graph of the following function \(-\sigma(x-3)\)
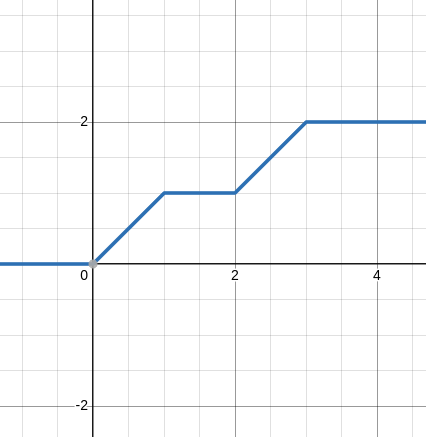
- If you can plot the above, try poling the combination of the above two: \(\sigma(x-2) -\sigma(x-3)\) Very good.
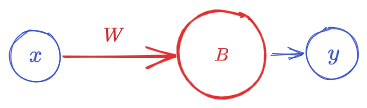
Neural network.
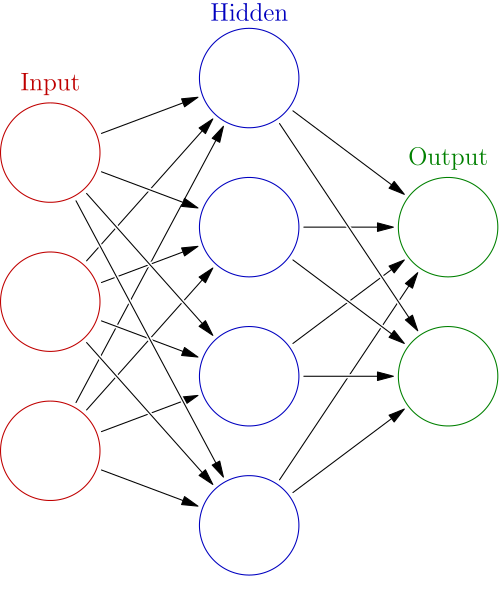
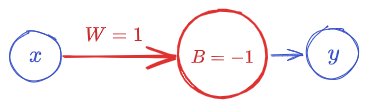
I took the above picture from the Wikipedia page. If you look here, you will get many things about its application, model, and a lot more, but now we will look at a particular example of a neural network and see how it works. Let’s begin. This is how a simple neuron looks; if we write it mathematically, it’s a function \(y:\mathbb{R}\to\mathbb{R}\). \(y(x) = \sigma(Wx + B)\) Where \(\sigma\) is the ReLU function that we looked at above.So \(\sigma(x)\) will look like:
Examples
We will repeat the above example and see how they look as neural networks.
\[\sigma(x+1)\]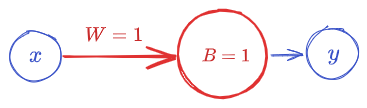
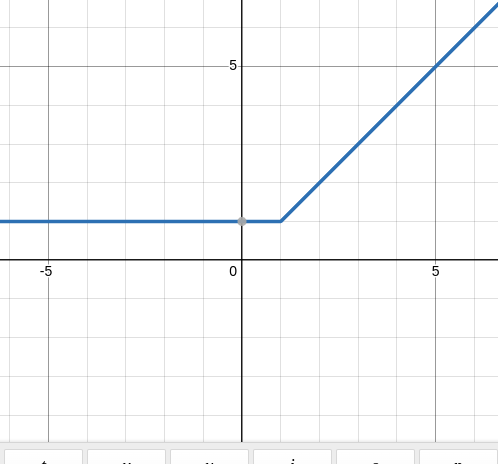
This one is a little tricky.
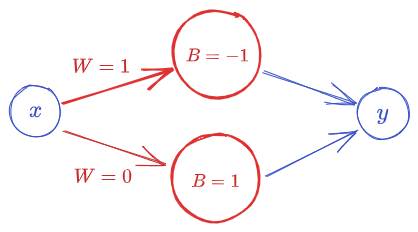 The above Neural Network represents \(\sigma(1 \times x-1) + \sigma(0 \times x +1) = \sigma(x-1) +1\)
Some More Examples
\[\sigma(x)- \sigma(x-1)\]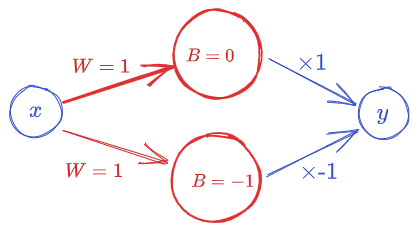
Some Exercise
This Exercise will make the above Idea concrete in your mind, and you will have no problem understanding Neural networks.
- Plot the graph of the following function \(-\sigma(x-1)\)
- Plot the graph of the following function \(\sigma(x-2)\)
- Plot the graph of the following function \(-\sigma(x-3)\)
- If you can plot the above, try poling the combination of the above two: \(\sigma(x-2) -\sigma(x-3)\)
Very good.